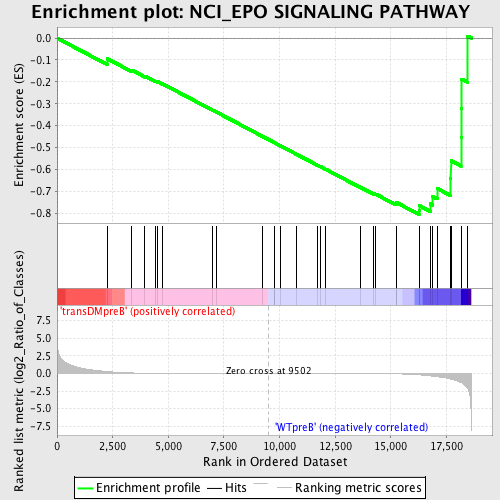
Profile of the Running ES Score & Positions of GeneSet Members on the Rank Ordered List
| Dataset | Set_04_transDMpreB_versus_WTpreB.phenotype_transDMpreB_versus_WTpreB.cls #transDMpreB_versus_WTpreB |
| Phenotype | phenotype_transDMpreB_versus_WTpreB.cls#transDMpreB_versus_WTpreB |
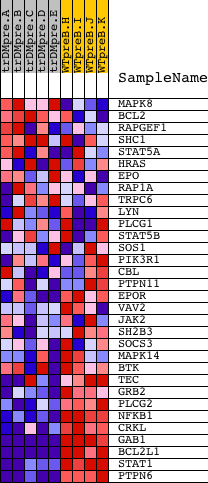
| Upregulated in class | WTpreB |
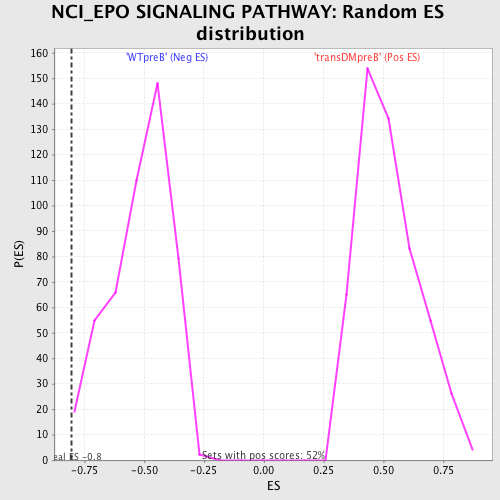
| GeneSet | NCI_EPO SIGNALING PATHWAY |
| Enrichment Score (ES) | -0.8054854 |
| Normalized Enrichment Score (NES) | -1.5613352 |
| Nominal p-value | 0.008350731 |
| FDR q-value | 0.10973535 |
| FWER p-Value | 0.726 |
| PROBE | DESCRIPTION (from dataset) | GENE SYMBOL | GENE_TITLE | RANK IN GENE LIST | RANK METRIC SCORE | RUNNING ES | CORE ENRICHMENT | |
|---|---|---|---|---|---|---|---|---|
| 1 | MAPK8 | 6459 | 2251 | 0.267 | -0.0940 | No | ||
| 2 | BCL2 | 8651 3928 13864 4435 981 4062 13863 4027 | 3347 | 0.070 | -0.1458 | No | ||
| 3 | RAPGEF1 | 4218 2860 | 3945 | 0.040 | -0.1739 | No | ||
| 4 | SHC1 | 9813 9812 5430 | 4437 | 0.027 | -0.1975 | No | ||
| 5 | STAT5A | 20664 | 4526 | 0.025 | -0.1997 | No | ||
| 6 | HRAS | 4868 | 4722 | 0.022 | -0.2079 | No | ||
| 7 | EPO | 8911 | 7000 | 0.007 | -0.3298 | No | ||
| 8 | RAP1A | 8467 | 7144 | 0.006 | -0.3368 | No | ||
| 9 | TRPC6 | 19565 | 9241 | 0.001 | -0.4495 | No | ||
| 10 | LYN | 16281 | 9749 | -0.001 | -0.4767 | No | ||
| 11 | PLCG1 | 14753 | 9774 | -0.001 | -0.4780 | No | ||
| 12 | STAT5B | 20222 | 10036 | -0.001 | -0.4919 | No | ||
| 13 | SOS1 | 5476 | 10751 | -0.003 | -0.5300 | No | ||
| 14 | PIK3R1 | 3170 | 11690 | -0.006 | -0.5798 | No | ||
| 15 | CBL | 19154 | 11840 | -0.006 | -0.5872 | No | ||
| 16 | PTPN11 | 5326 16391 9660 | 12084 | -0.007 | -0.5995 | No | ||
| 17 | EPOR | 19204 | 13635 | -0.017 | -0.6812 | No | ||
| 18 | VAV2 | 5848 2670 | 14223 | -0.025 | -0.7102 | No | ||
| 19 | JAK2 | 23893 9197 3706 | 14328 | -0.027 | -0.7130 | No | ||
| 20 | SH2B3 | 5001 16383 | 15241 | -0.058 | -0.7562 | No | ||
| 21 | SOCS3 | 20131 | 15249 | -0.059 | -0.7505 | No | ||
| 22 | MAPK14 | 23313 | 16271 | -0.200 | -0.7852 | Yes | ||
| 23 | BTK | 24061 | 16291 | -0.204 | -0.7654 | Yes | ||
| 24 | TEC | 16514 | 16770 | -0.340 | -0.7566 | Yes | ||
| 25 | GRB2 | 20149 | 16888 | -0.389 | -0.7233 | Yes | ||
| 26 | PLCG2 | 18453 | 17084 | -0.464 | -0.6866 | Yes | ||
| 27 | NFKB1 | 15160 | 17682 | -0.778 | -0.6396 | Yes | ||
| 28 | CRKL | 4560 | 17704 | -0.794 | -0.5601 | Yes | ||
| 29 | GAB1 | 18828 | 18157 | -1.275 | -0.4548 | Yes | ||
| 30 | BCL2L1 | 4440 2930 8652 | 18170 | -1.310 | -0.3223 | Yes | ||
| 31 | STAT1 | 3936 5524 | 18185 | -1.330 | -0.1878 | Yes | ||
| 32 | PTPN6 | 17002 | 18450 | -2.074 | 0.0089 | Yes |